SL Paper 3
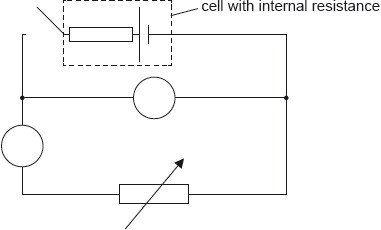
The circuit shown may be used to measure the internal resistance of a cell.

The ammeter used in the experiment in (b) is an analogue meter. The student takes measurements without checking for a “zero error” on the ammeter.
An ammeter and a voltmeter are connected in the circuit. Label the ammeter with the letter A and the voltmeter with the letter V.
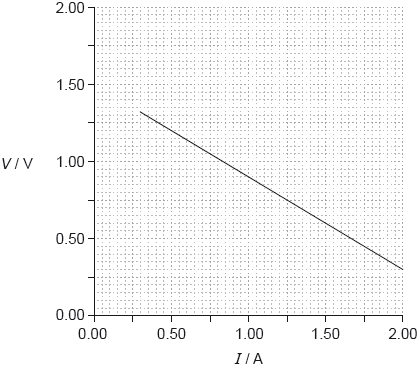
In one experiment a student obtains the following graph showing the variation with current I of the potential difference V across the cell.

Using the graph, determine the best estimate of the internal resistance of the cell.
State what is meant by a zero error.
After taking measurements the student observes that the ammeter has a positive zero error. Explain what effect, if any, this zero error will have on the calculated value of the internal resistance in (b).
Markscheme
correct labelling of both instruments
[1 mark]
V = E – Ir
large triangle to find gradient and correct read-offs from the line
OR
use of intercept E = 1.5 V and another correct data point
internal resistance = 0.60 Ω
For MP1 – do not award if only is used.
For MP2 points at least 1A apart must be used.
For MP3 accept final answers in the range of 0.55 Ω to 0.65 Ω.
[3 marks]
a non-zero reading when a zero reading is expected/no current is flowing
OR
a calibration error
OWTTE
Do not accept just “systematic error”.
[1 mark]
the error causes «all» measurements to be high/different/incorrect
effect on calculations/gradient will cancel out
OR
effect is that value for r is unchanged
Award [1 max] for statement of “no effect” without valid argument.
OWTTE
[2 marks]
Examiners report
An electrical circuit is used during an experiment to measure the current I in a variable resistor of resistance R. The emf of the cell is e and the cell has an internal resistance r.
A graph shows the variation of with R.
Show that the gradient of the graph is equal to .
State the value of the intercept on the R axis.
Markscheme
«ε = IR + Ir»
identifies equation with y = mx + c
«hence m = »
No mark for stating data booklet equation
Do not accept working where r is ignored or ε = IR is used
OWTTE
«–» r
Allow answer in words
Examiners report
A student investigates the electromotive force (emf) ε and internal resistance r of a cell.
The current I and the terminal potential difference V are measured.
For this circuit V = ε - Ir .
The table shows the data collected by the student. The uncertainties for each measurement
are shown.
The graph shows the data plotted.
The student has plotted error bars for the potential difference. Outline why no error bars are shown for the current.
Determine, using the graph, the emf of the cell including the uncertainty for this value. Give your answer to the correct number of significant figures.
Outline, without calculation, how the internal resistance can be determined from this graph.
Markscheme
ΔI is too small to be shown/seen
OR
Error bar of negligible size compared to error bar in V ✔
evidence that ε can be determined from the y-intercept of the line of best-fit or lines of min and max gradient ✔
states ε=1.59 OR 1.60 OR 1.61V«» ✔
states uncertainty in ε is 0.02 V«» OR 0.03«V» ✔
determine the gradient «of the line of best-fit» ✔
r is the negative of this gradient ✔
Examiners report
Almost all candidates realised that the uncertainty in I was too small to be shown. A common mistake was to mention that since I is the independent variable the uncertainty is negligible.
The number of candidates who realised that the V intercept was EMF was disappointing. Large numbers of candidates tried to calculate ε using points on the graph, often ending up with unrealistic values. Another common mistake was not giving values of ε and Δε to the correct number of digits - 2 decimal places on this occasion. Very few candidates drew maximum and minimum gradient lines as a way of determining Δε.
The resistance R of a wire of length L can be measured using the circuit shown.
In one experiment the wire has a uniform diameter of d = 0.500 mm. The graph shows data obtained for the variation of R with L.
The gradient of the line of best fit is 6.30 Ω m–1.
Estimate the resistivity of the material of the wire. Give your answer to an appropriate number of significant figures.
Explain, by reference to the power dissipated in the wire, the advantage of the fixed resistor connected in series with the wire for the measurement of R.
The experiment is repeated using a wire made of the same material but of a larger diameter than the wire in part (a). On the axes in part (a), draw the graph for this second experiment.
Markscheme
evidence of use of ρ = given gradient × wire area
OR
substitution of values from a single data point with wire area ✔
✔
NOTE: Check POT is correct.
MP2 must be correct to exactly 3 s.f.
measurement should be performed at a constant temperature
OR
resistance of wire changes with temperature ✔
series resistance prevents the wire from overheating
OR
reduces power dissipated in the wire ✔
by reducing voltage across/current through the wire ✔
ANY straight line going through the origin if extrapolated ✔
ANY straight line below existing line with smaller gradient ✔